Sufficient Dimension Reduction
::: {.cell}
:::
1 Overview
Sufficient Dimension Reduction (SDR) is a statistical methodology aimed at reducing the dimensionality of predictors in statistical learning problems without losing information about the relationship of interest between the predictors and the response variable. This set of tools provides a way to simplify high-dimensional data while preserving the essential characteristics of that data that influence the outcome of interest. By focusing on the relationship between predictors and the response, SDR bridges traditional unsupervised dimensionality reduction and predictive modeling.
In contrast to methods like principal component analysis (PCA), which aims to capture the variance structure of the predictors as a best descriptor of the predictor, SDR identifies a lower-dimensional subspace where the response variable remains fully predictable from the subspace. This targeted approach makes SDR particularly valuable in applications where interpretability and relevance to a specific outcome are critical.
SDR has found applications across diverse domains such as:
Machine Learning: Improving model performance by reducing noise and irrelevant features in high-dimensional data.
Bioinformatics: Identifying genetic markers associated with diseases from large genomic datasets.
Social Sciences: Simplifying complex survey data to uncover key drivers of societal behaviors.
This combination of dimensionality reduction with response-driven focus allows SDR to address challenges in high-dimensional settings, where the number of predictors often exceeds the number of observations. By uncovering lower-dimensional structures that are sufficient for prediction, SDR supports efficient, interpretable, and robust modeling in data-rich environments.
2 Introduction
Sufficient Dimension Reduction (SDR) is an area of statistics that focuses on reducing high dimensional data to a just a few features that reflect, or summarize, all of the information available in the data about a specific outcome of interest. In data science parlance, SDR can be considered methods for “supervised dimension reduction” or “supervised learning”.
Ideally, the features will be more interpretable than trying to use the entire set of predictors. Then any subsequent model built upon the supervised features should be more interpretable as well. In terms of interpretability, the constructed features are easier to visualize, since there are only a few to consider. We can plot the supervised features against the outcome using 1d, 2d, and 3d graphics, which facilitates the interpretation of the features relative to the outcome. And these interpretations can help reinforce and build a stronger understanding of the relationship between the outcome of interest and predictors.
For references, a recent monograph on Sufficient Dimension Reduction serves as a good starting point Li (2018). In addition, the recent monograph on envelope methods, which have a close connection to sufficient dimension reduction, can also be insightful Cook (2018).
3 Key Concepts
3.1 Dimensionality Reduction
Dimensionality reduction techniques aim to simplify datasets by reducing the number of variables (features) while retaining as much meaningful information as possible.
Traditional methods include: - Principal Component Analysis (PCA): Focuses on maximizing variance. - Factor Analysis: Models data with latent variables.
In contrast, SDR identifies a lower-dimensional subspace of predictors that retains all the information about the response.
3.2 Sufficiency
The term “sufficient” refers to the statistical concept that a set of variables or transformations of variables is sufficient if it retains all the information needed to predict the response variable. In the context of SDR, this means finding a subspace such that the conditional distribution of the response given the original predictors is the same as that given the reduced predictors.
Formally, let \(\mathbf{X}\) denote the predictor variables and \(Y\) denote the response variable. SDR seeks a reduction \(\mathbf{R}(\mathbf{X})\) such that:
\[ Y \perp \mathbf{X} | \mathbf{R}(\mathbf{X}) \]
where \(\perp\) denotes conditional independence.
4 An Illustration
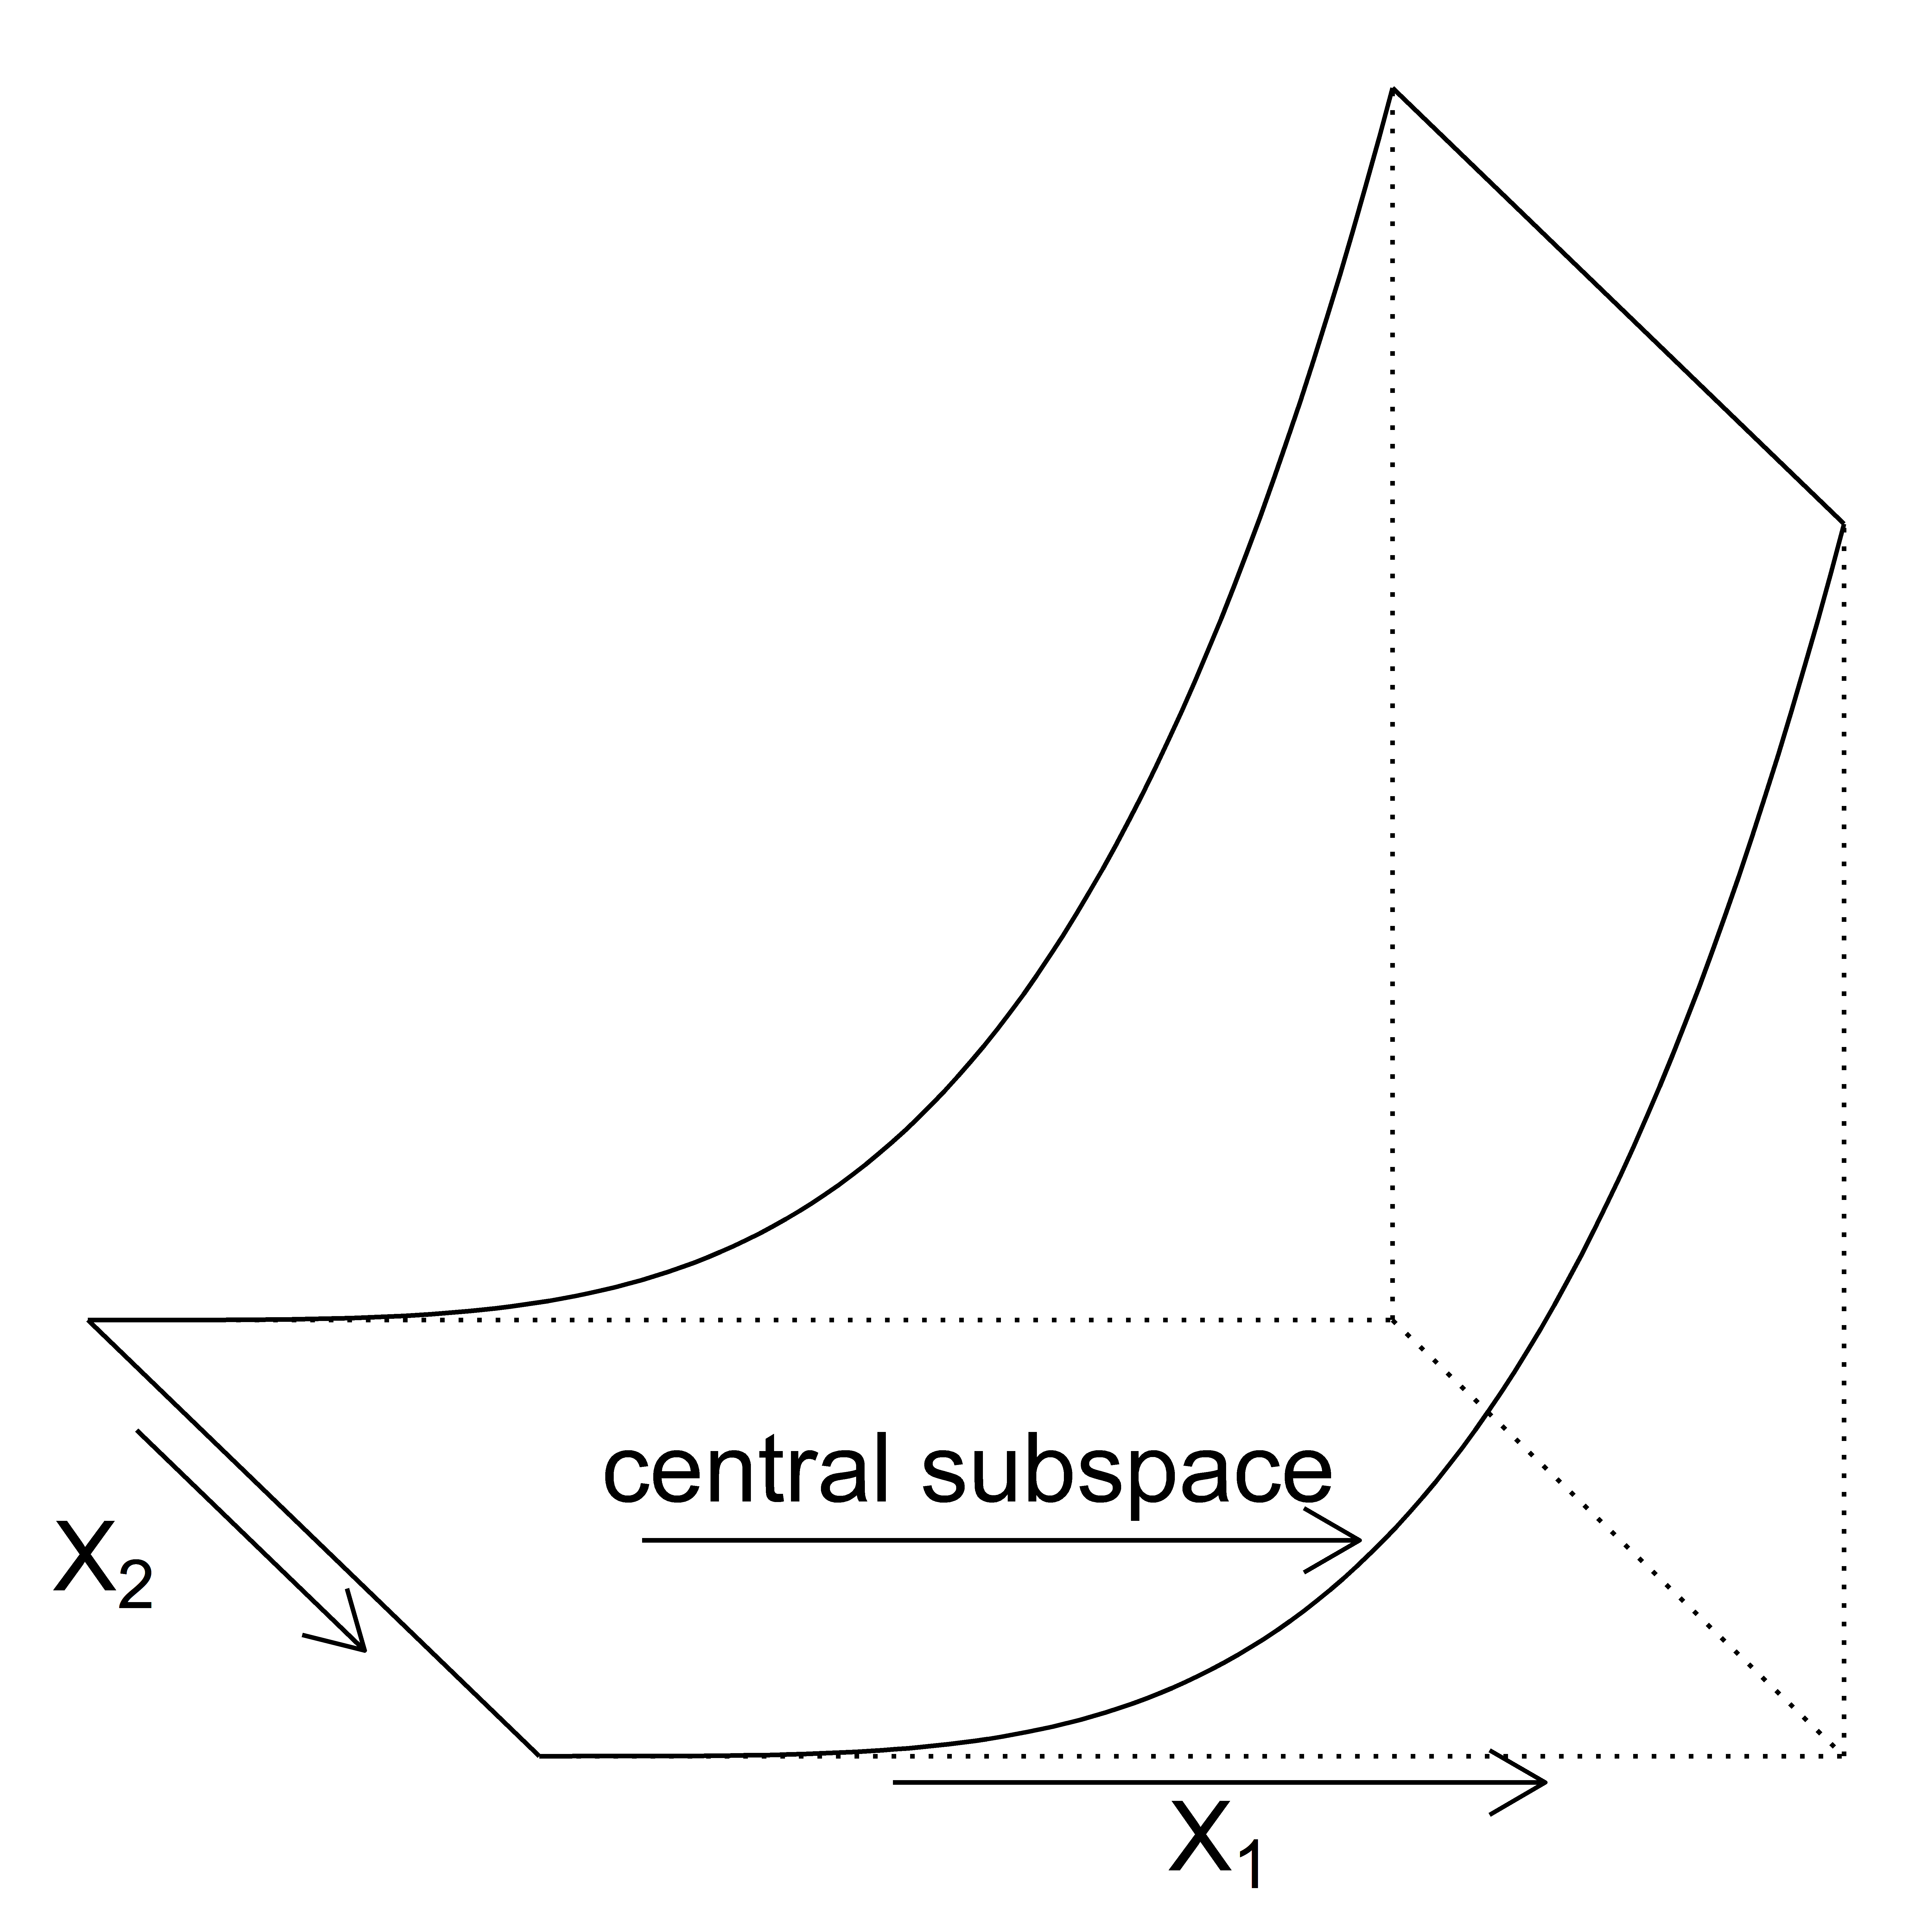
To illustrate the objective of SDR methods, consider a simple example. Let \(X = (X_1, X_2) \in [0,1]^2\) be a bivariate predictor in the unit square and let \(Y \in \R\) be a quadratic function of \(X_1\). Then, letting \(\beta = (1,0) \in \R^2\), the outcome \(Y\) can be expressed as \(Y = \beta^\top X\). The goal of SDR is to recover the subspace spanned by \(\beta\), referred to as the central subspace in the SDR literature.
5 Formal definitions
For \[ \begin{split} Y \indep X \mid \beta^\top X \end{split} \]
6 Relationship with Supervised and Unsupervised Learning
SDR lies at the intersection of supervised and unsupervised learning:
Supervised Learning: SDR is closely tied to supervised learning because it explicitly leverages the response variable (\(Y\)) to determine the relevant features or subspaces. This contrasts with purely unsupervised methods like PCA, which do not use information about the response.
Unsupervised Learning: While SDR uses the response variable to guide the reduction, it shares similarities with unsupervised methods in its goal of simplifying the feature space. For example, techniques like PCA reduce dimensionality without considering the response, while SDR incorporates the response to achieve a more targeted reduction.
In summary, SDR can be seen as a supervised approach to dimensionality reduction, as it depends on the relationship between predictors and the response to identify sufficient subspaces.
7 Methods in Sufficient Dimension Reduction
Several methods have been developed for SDR. Below are some of the most commonly used approaches:
7.0.1 1. Sliced Inverse Regression (SIR)
- Idea: Explores the inverse regression of predictors given the response, leveraging the reduction in dimensionality.
- Key Assumption: Predictors are elliptically symmetric (e.g., normally distributed).
7.0.2 2. Sliced Average Variance Estimation (SAVE)
- Idea: Focuses on capturing variations in the covariance structure of predictors across slices of the response.
- Key Feature: Useful for capturing nonlinear dependencies.
7.0.3 3. Principal Hessian Directions (PHD)
- Idea: Based on the second derivative (Hessian) of the regression function to identify relevant directions.
- Strength: Can uncover higher-order structures.
7.0.4 4. Minimum Average Variance Estimation (MAVE)
- Idea: Directly minimizes a loss function to identify the sufficient dimension-reducing subspace.
7.0.5 5. Conditional Variance-Based Methods
- These approaches aim to identify subspaces by minimizing conditional variances of the response given the predictors.
8 Advantages of SDR
Interpretability: SDR provides meaningful, low-dimensional representations of data, making it easier to interpret the relationship between predictors and response variables.
- For example, in applications like genomics or finance, SDR can reveal key factors driving the observed outcomes.
Efficiency: By reducing the number of predictors, SDR decreases computational costs in model training and inference, which is particularly valuable for high-dimensional datasets.
- Efficient computation enhances the scalability of statistical and machine learning models.
Noise Reduction: SDR helps in filtering out irrelevant or noisy predictors that do not contribute to understanding the response variable.
- This leads to models that are more robust and generalize better to unseen data.
Versatility: SDR is applicable to a wide range of relationships, from linear to complex nonlinear associations between predictors and the response.
Nonparametric Extensions: SDR methods can be extended to accommodate flexible, data-driven modeling approaches, allowing for greater adaptability to various data structures and distributions.
Improved Visualization: By reducing data to a lower-dimensional subspace, SDR facilitates visual exploration and understanding of the relationship between predictors and response, aiding in hypothesis generation and communication of findings.
9 Applications
- Genomics:
- SDR helps identify genetic markers that are most associated with certain traits or diseases. This is particularly useful in genome-wide association studies (GWAS), where the number of predictors (genes) far exceeds the number of observations.
- Example: Discovering genes associated with cancer susceptibility (Chen et al., 2010).
- Finance:
- In financial modeling, SDR is used to identify latent factors that explain asset price movements, manage portfolio risks, or forecast market trends.
- Example: Dimensionality reduction in factors affecting stock returns or credit risk analysis (Connor et al., 1988).
- Marketing:
- SDR aids in understanding consumer behavior by analyzing high-dimensional survey or transaction data. This can lead to better customer segmentation and targeted marketing strategies.
- Example: Identifying key factors influencing customer loyalty (Wedel & Kamakura, 2000).
- Medicine:
- High-dimensional data from medical imaging (e.g., MRI scans) or clinical studies can be reduced using SDR to identify critical features associated with diseases or outcomes.
- Example: Predicting disease progression based on imaging biomarkers (Zhu et al., 2014).
- Environmental Science:
- SDR is used to analyze climate data, where numerous predictors (e.g., temperature, humidity, CO2 levels) are linked to environmental outcomes.
- Example: Identifying factors contributing to climate change or biodiversity loss (Hastie et al., 2009).
- Social Sciences:
- Analyzing survey data or behavioral studies often involves numerous variables. SDR helps isolate key factors that influence societal trends or policy outcomes.
- Example: Understanding factors affecting voter behavior in elections (Bollen et al., 1989).
- Manufacturing and Quality Control:
- SDR is applied to sensor data in manufacturing processes to monitor quality and predict failures.
- Example: Identifying key features in sensor data that signal equipment malfunction (Russell et al., 2000).
10 Further Reading
For those interested in exploring SDR further, consider the following resources:
- Li, K.-C. (1991). Sliced Inverse Regression for Dimension Reduction. Journal of the American Statistical Association.
- Cook, R. D. (1998). Regression Graphics: Ideas for Studying Regressions through Graphics. Wiley.
- Lee, K.-E., et al. (2013). Efficient Dimension Reduction for Multivariate Regression. Journal of Statistical Software.
This document provides a high-level overview of SDR. Detailed implementation and examples will be discussed in subsequent sections.